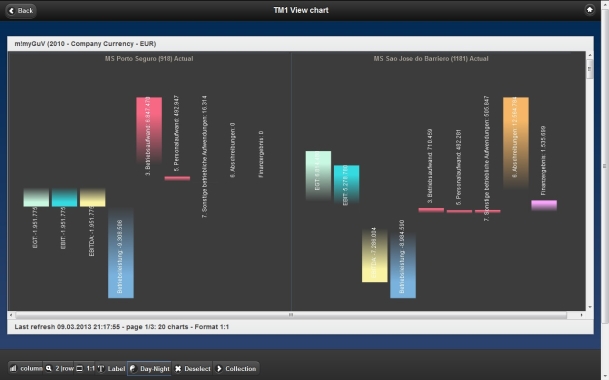
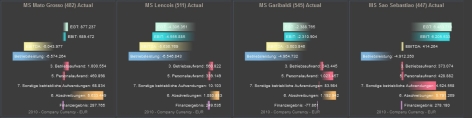
TM1mobile provides a unique multi chart engine.
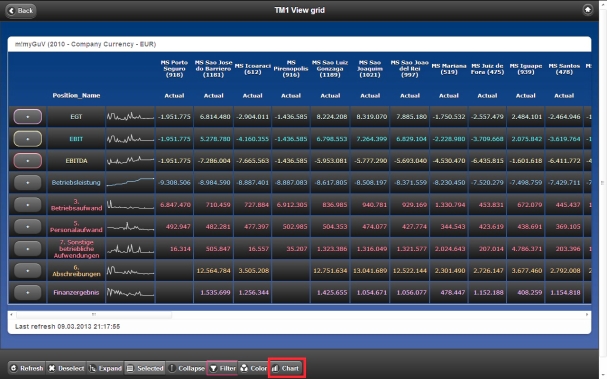
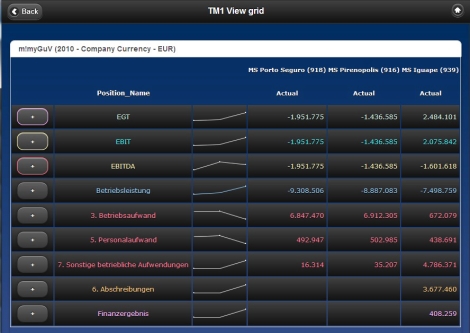
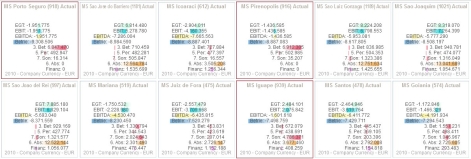
Just select the rows in
TM1 View
grid you'll like to chart:and push the "Chart"-button:
The chart colors are corresponding with the
(individual) font colors of the selected rows.
Chart functions
|
Function button
|
action
|
|
|
Select your favourite chart type: column, bar or pie.
|
|
|
Select the number of charts per row: 1, 2, 3, 4, 6, 12.
|
|
|
Select the chart's display format: 1:1, 4:3, 16:9, screen, 1:2.
|
|
|
Label toggles the chart's labels between full length and short
length.
|
|
|
Day-Night toggles the chart's background between day (light) and
night (dark).
 |
|
|
Deselect removes all chart selections.
Selecting a chart by touching it turns its border
to red color,
deselecting a chart by touching it again removes the border.
 Special Tip - grid column selection
by chart selection:
Push the "Back"-Button and following
"Selected"-Button for reducing columns by selected charts:
|
|
|
Collection shows your selected charts in a HTML5 image format for
further chart processings in Email, notes and presentation.
 |
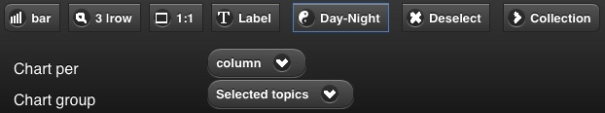
Advanced chart functions
|
Function
button
|
action
|
|
|
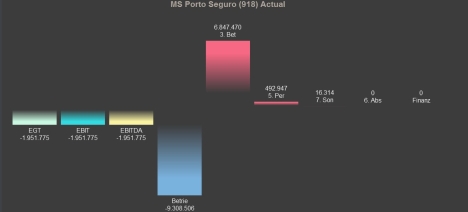
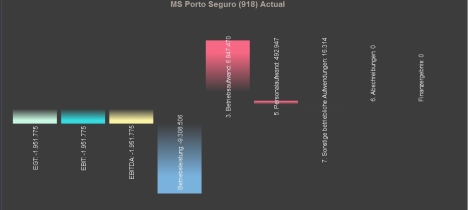
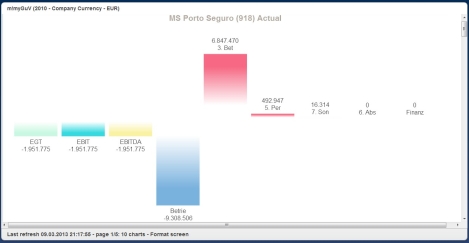
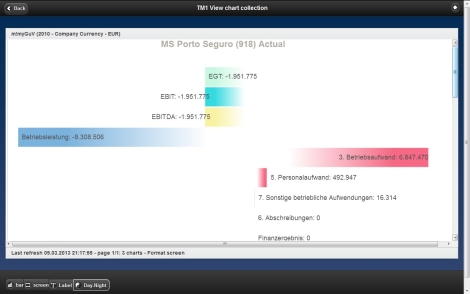
Chart per row
Switch the chart view from column to row to show
the grid rows chart by chart and the grid
columns as chart bars:
|
|
|
|
|

|
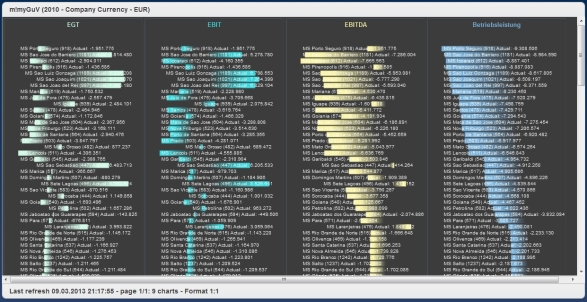
Selected topics
Switch the chart group from All selections to
Selected topics to show the "drill down" of your parent (+)
rows - each parent (topic) chart containing its children.
|
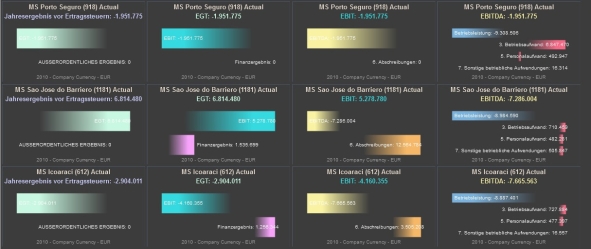
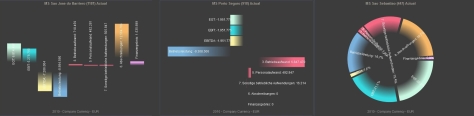
Special tip - scroll through your
entire enterprise
 Select the number of charts per row synchronously
to the number of your selected parent rows: Show the complete drill
down per column within one chart row. Now you can scroll row by row
through your enterprise visually.
|
|
|

|
Filter group
Switch the chart group from Selected topics to
Filter group to show the "grouped dimensions" of your
TM1 View grid filter
settings within a single chart.
Filter settings / group definition:
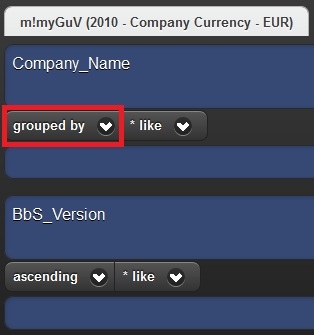 The dimension "Version" (Actual and Plan)
is grouped within
dimension "Company".
|
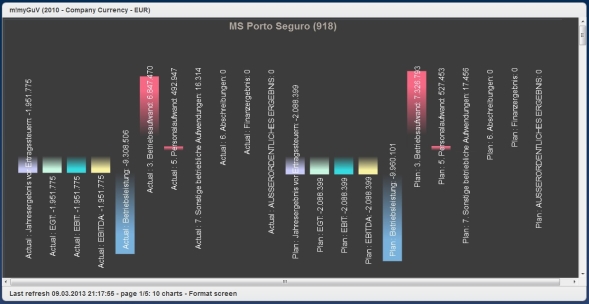
The absolute proportions of "Actual" and "Plan"
are realized within a chart by grouping all chart elements
synchronously to the group filter settings.
|
|
|